Seacrest Beach Market Update February 2013

Between the years 2007 to 2010, the prices of homes in Seacrest Beach dropped approximately thirty percent. However, the rate of decrease in average cost per square foot leveled out in 2011 and 2012. It is hopeful that the sales from early 2013 are a sign of a rising real estate market.
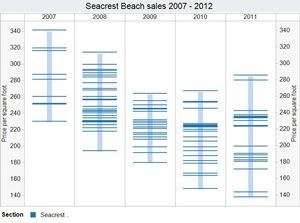
Of the eleven homes sold in Seacrest Beach in 2007, the average cost per square foot was $281. While the amount of homes sold in 2008 tripled, the average cost per square foot dropped nine percent to $256. The amount of homes sold in 2009 dropped to twenty-two, and the average cost per square foot dropped fourteen percent to $224. There were only two more sales in 2010 than in 2009, but even with the minimal increase in sales, the average cost per square foot dropped another five percent to $213.
Click on image below to see the full size graph
After the two percent per square foot fall in 2010 to 2011, prices have remained steady at $209 throughout the remainder of 2011 and 2012. One-third of the twenty homes sold in 2011 were distressed sales. Although one-third of the home sales in 2012 were also distressed, there were thirty-two homes sold in 2012, showing an increase in sales volume.
Four of the thirty-two homes sold in 2012 closed in December. Two of the homes sold at $227 and $228 per square foot, above the average cost, but of the other two homes sold, one sold just below average at $208 for a standard sale and the other sold at $158 for a short sale.
Year 2013 Seacrest Beach home sales have begun with costs per square foot above the prior two years. One home sold for $210 per square foot while the other home, which was adjacent to 30a, sold for $280 per square foot. Considering two of the above-average sales from December 2012 and the two from the beginning of 2013, it could be that the market might be on an upswing.
- Created on .
- Hits: 6795
